California’s Largest Sources of Greenhouse Gas Emissions
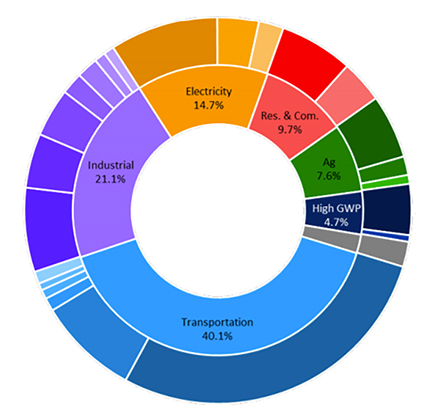 In our effort to Get to Zero greenhouse gas emissions, we first need to identify where emissions are coming from. The pie chart to the right, modified from California’s 2017 Scoping Plan, shows the major areas of emissions in our state.
In this post, I break down the largest sectors by their share of greenhouse gas emissions. Then, I highlight some key guiding questions. This post is a high-level overview of California's greenhouse gas emissions by sectors, but I will elaborate on each key sector in future entries.
Broadly, what gets us “to zero”?
ELECTRICITY. Even though electricity accounts for only 14.7% of emissions, all credible plans to get to net zero emissions require widespread electrification of other sectors — to charge electric vehicles, heat and cool homes, and more. Therefore, decarbonizing our electricity is foundational to everything else we are doing. At the same time, with a growing movement toward home electrification and EV use, electricity use is expected to double or triple by 2045. All that additional electricity had better be from clean sources!
The electricity sector has made more progress than any other sector, with more than 60% of our electricity coming from renewable and other zero carbon sources already. But getting to 100% clean energy will not be easy. We need bold measures that move us forward faster. As a member of the Senate Energy, Utilities and Communications Committee, I look forward to reviewing strong proposals that enable this transition. I’ll also offer my own legislation, such as my Senate Bill 67, to improve and bolster long-term zero-carbon energy planning.
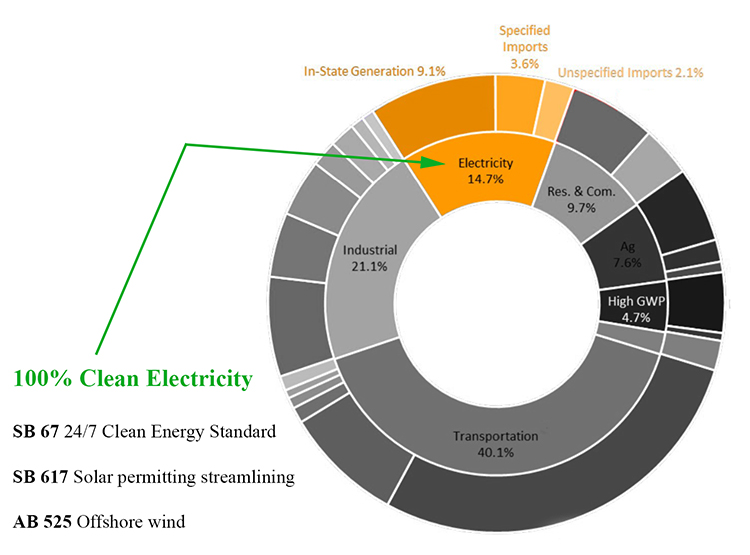
With the retirement of the nuclear Diablo Canyon Power Plant, which previously was the largest power plant in California providing 2.2GW (7%) of the state’s energy, our state will also need to make up for this power loss. After delaying for years, the California Public Utilities Commission recently issued an important directive for utilities to buy replacement sources of clean energy to make up for Diablo Canyon (and more), which I’ll delve into deeper in a future blog post.
TRANSPORTATION. The biggest bucket of emissions comes from transportation (40.1%). Most of the emissions in this sector come from passenger vehicles (28.0%), but there are other transportation-related emissions too. In the industrial sector, about half of the emissions (11.1%) come from oil and gas production and refineries that are almost entirely devoted to production of transportation fuels. Taken together, the transportation sector and production of transportation fuels account for more than half of the state’s emissions.
Improved electric vehicle infrastructure, market incentives, public transportation, more housing close to job centers, and biking and walking trails and systems will help us get closer to zero in the transportation sector. My membership on the Senate Transportation Committee provides another opportunity for me to be a steward for transition. My legislation in this area includes SB 771, which I introduced this year to incentivize swifter adoption of clean vehicles by providing Californians with a sales tax exemption for low-cost or used EV purchases.
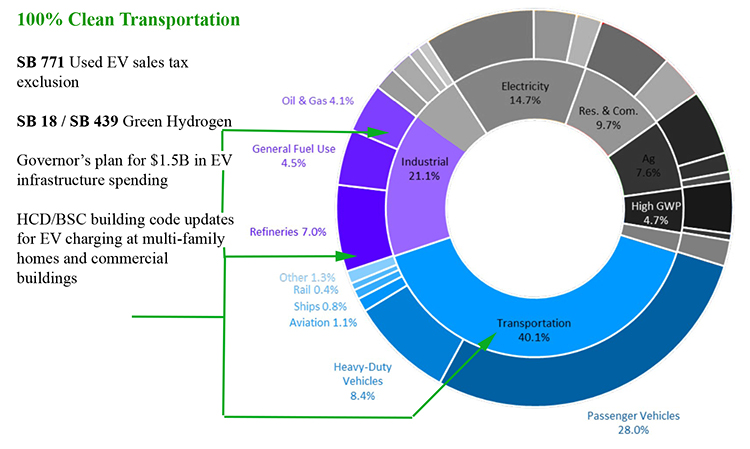
Currently, California has 860,000 EVs on the road and 73,000 public and shared chargers installed. Yet, our state goals aim for California to have 5 million zero emission vehicles and 1.2 million EV chargers by 2030 to meet our emission reduction targets. In order to do so, this year’s budget is a good start, as it includes (1) $2.7 billion that is allocated in the 2021-2022 budget, and (2) $3.9 billion allocated for EV acceleration of light and heavy duty vehicles, development of zero emission public transit, and bettering of supply chain for manufacturing ZEVS in the next three years. But funding for EVs and EV infrastructure must continue to be a priority and expanded upon.
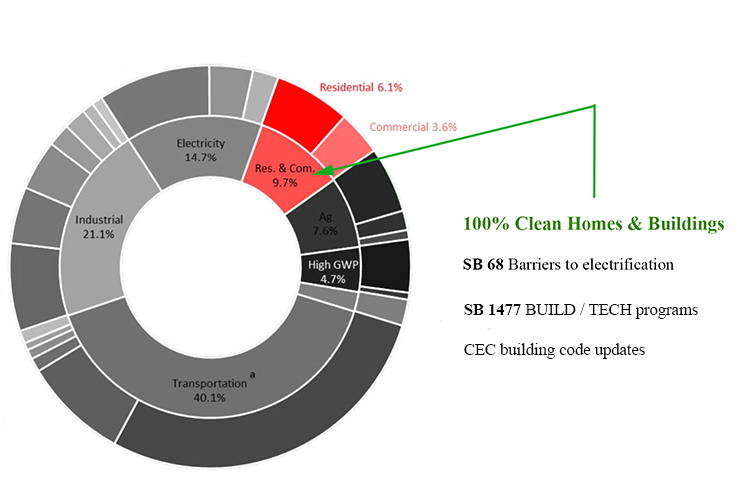
BUILDING ELECTRIFICATION. After transportation and electricity, the next big bucket is the 9.7% of emissions that come from homes and commercial buildings — primarily through widespread use of gas appliances.
My work to support building decarbonization efforts includes SB 68, which aims to reduce barriers for electrifying heating, cooking, vehicle charging and more.
INDUSTRIAL DECARBONIZATION.
Excluding industrial emissions related to transportation, the remainder of the industrial sector accounts for about 10% of the state’s emissions. A large portion of this comes from the use of fossil fuels for energy and process heat in a wide variety of manufacturing processes. In some cases, these processes could be converted to clean electricity for both power and heat; however, especially for high temperature processes, other pathways are needed, such as converting to green hydrogen as the input fuel.
Another significant category of industrial emissions are leaks from natural gas pipelines and storage facilities, which can be reduced with better leak detection technology and monitoring practices. These should also decline as we reduce our end uses of natural gas in buildings and as an industrial fuel.
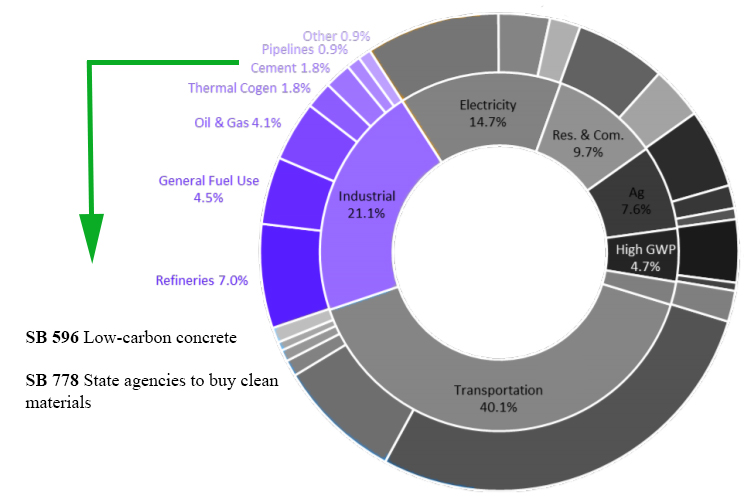
The largest single industrial sector in California after oil & gas is cement manufacturing, representing about 2% of the state’s emissions. Globally, cement is 7% of all carbon emissions, so it becomes a crucial area to solve, and is an example of how we can create policies in California that have a global impact. This year, I worked closely with environmental groups and the cement industry on SB 596 to move the industry to net zero by 2045, with interim targets to mandate progress. This has been a very positive process so far, as the industry has acknowledged their need to make this change. They also have stated they want to ensure emissions reductions are rewarded and companies which decarbonize are protected from unfair competition from out-of-state producers, who are not subject to the same rules.
We came up with a successful framework to achieve this in SB 596. The bill has received bipartisan support and has been praised as an example of how to bring businesses along into a decarbonized future. I am already working on a follow-up bill for next year, SB 778, that will add low carbon concrete to the state’s Buy Clean law in order to help drive demand for the low carbon cement produced under SB 596.
How do these sector breakdowns guide our policy framework?
In short, our team’s legislative focus is honed in on the sectors where our efforts for emissions reductions will have the “biggest reduction for our buck.” Based on these sector breakdowns, our approach of picking and curating legislation is guided by asking a few critical questions:
- What are the largest sources of emissions? In what areas would progress make the most difference?
- What policies and programs are already in place? Are they working? How can we support/push the leading regulatory agencies — CARB, CEC, CPUC, CAISO, CalEPA, etc. — in the work they are already doing to meet their emissions reductions targets in each sector?
- In what areas are we seeing insufficient progress? What new policies are needed to change that trajectory?
- Which sectors require a long lead time for changes and will therefore have a more difficult transition? Turning over the vehicle fleet, replacing gas appliances in millions of existing buildings, and transitioning “hard to abate” sectors like cement or aviation are good examples of sectors requiring longer lead times. How can we start making progress as soon as possible in these areas with long lead times?
###